Project Controlling Overview (Gantt chart)
Sep 10, 2015 6072 Print this page Download PDF Request support
You can see a graphical overview of the project’s status and its progress in a Gantt Chart at Implementation > Controlling > Status,
The Work Plan is in the left side panel. To see more detailed information about a specific Work Package click on the ![]() button of that Work Package. This will display its sub-level Tasks, Milestones, Deliverables and Work Documents.
button of that Work Package. This will display its sub-level Tasks, Milestones, Deliverables and Work Documents.
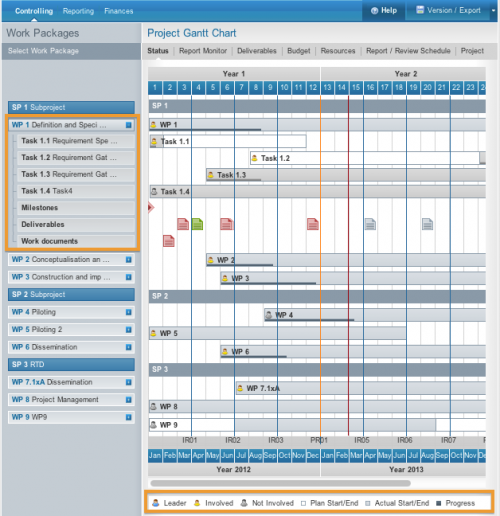
The vertical red line in the chart indicates the actual month (day) in the project.
The gaps between the blue vertical lines display the interim report periods. The orange vertical lines display the periodic report periods.
Sub-Projects, Work Packages and Tasks
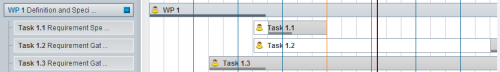
The grey bars indicate the actual start and end date of a Sub-Project, Work Package or Task. If the actual start/end date is in accordance with the planned start/end date, the chart reports no deviation. In cases where the actual start/end date of a Work Package or Task is postponed, the deviation is indicated as white bars behind the grey lines. The white bars reflect the timing according to the DoW.
You can set the actual start and end date of a Sub-Project and/or Work package by changing the actual start and end month of the subs level tasks linked to it at Implementation > Reporting >Progress. Click here to see more information on this.
Changes to the plan start/end date of a Sub-Project, Work Package or Task as part of a DoW adaptation need to be made by adjusting the Work Plan behind the DoW tab.
The dark line at the bottom of a Work package and Tasks bar shows the reported progress of a Work Package or Task, if progress is reported. For example, 50% completion is half the length of the grey bar. You can set the actual progress of a Work package and Task by defining a progress at task level in % at Implementation > Reporting > Progress. See further information here.
Deliverables and Milestones
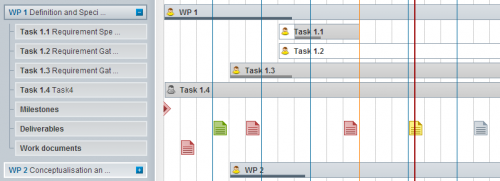
Deliverables/Work documents are displayed in accordance with their deadline, with which they should have the status Submitted (defined in the Deliverables Manager at Implementation > Controlling > Deliverables)
- Red: Overdue (the deadline of achieving Submitted status has past and status has not been reported)
- Yellow: Due soon (Submitted deadline is due soon)
- Green: Submitted status achieved and reported
- Grey: Not due (no deadline currently pending for Submitted status)
Milestones are shown accordance with the last reported, actual forecast achievement month (defined in the Milestone Reporting at Implementation > Reporting > Milestones)
- Red: Overdue (actual forecast achievement month has past and milestone has not been reported as achieved)
- Yellow: Due soon (actual forecast achievement month is due soon)
- Green: Milestone reported as achieved
- Grey: Not due (actual forecast achievement month is not due)
To see more detailed information for a particular Work Package, Task, Deliverable or Milestone, click on the specific item to activate the dialogue box.
You can find a key to reading the chart at the bottom of the page of Implementation > Controlling > Status
Related Articles
-
Managing Reporting Periods
July, 13 2014 4
-
Budget vs. Actual Costs Controlling
October, 13 2012 4
-
Resources Controlling: Plan vs Actual Staff Effort Overview
July, 10 2012 3
-
Deliverable Manager
July, 7 2012 5
-
Report Monitor
July, 4 2012 4